MGMountain guideVerified proExample Guides AG
AvalancheSlab · D2 · natural
WhereNE · 2,850 m · 38°
ProblemWind slab
TestECTP12 SC down 45
One map. Every layer.
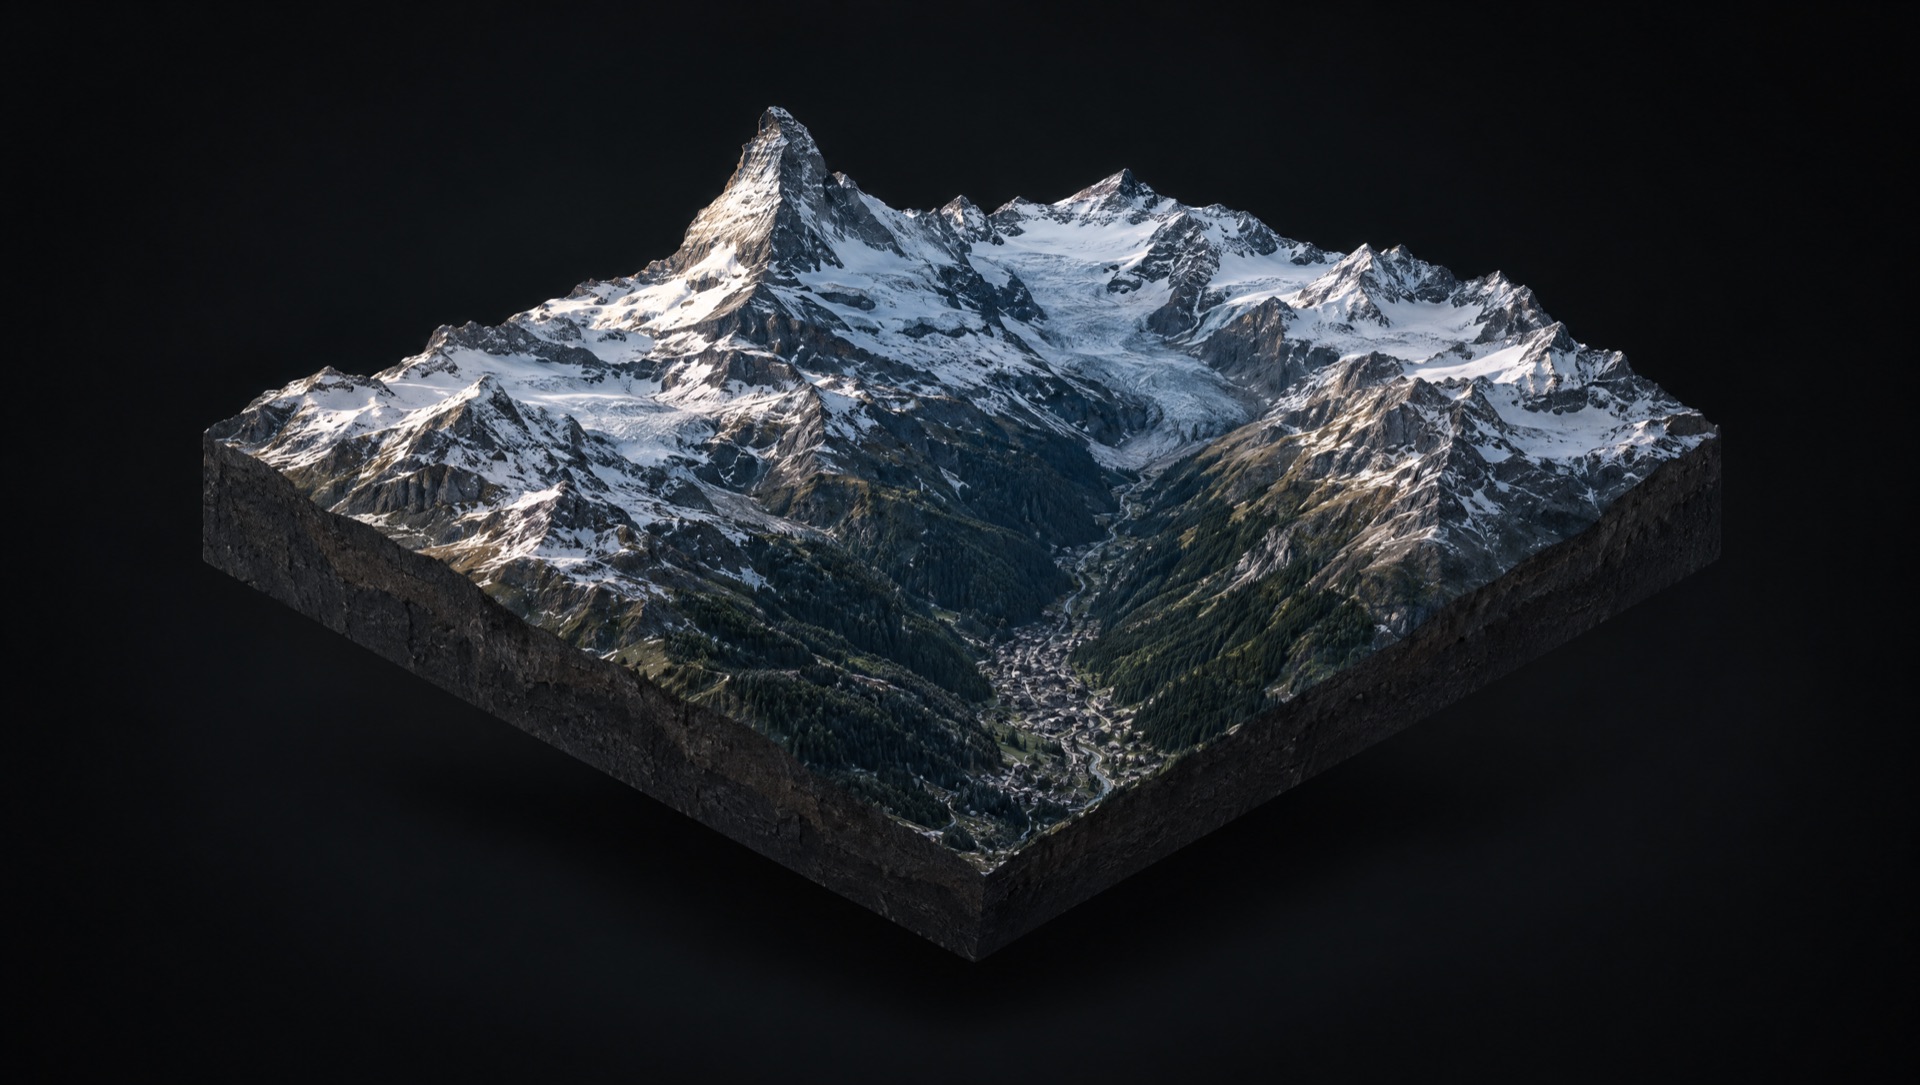
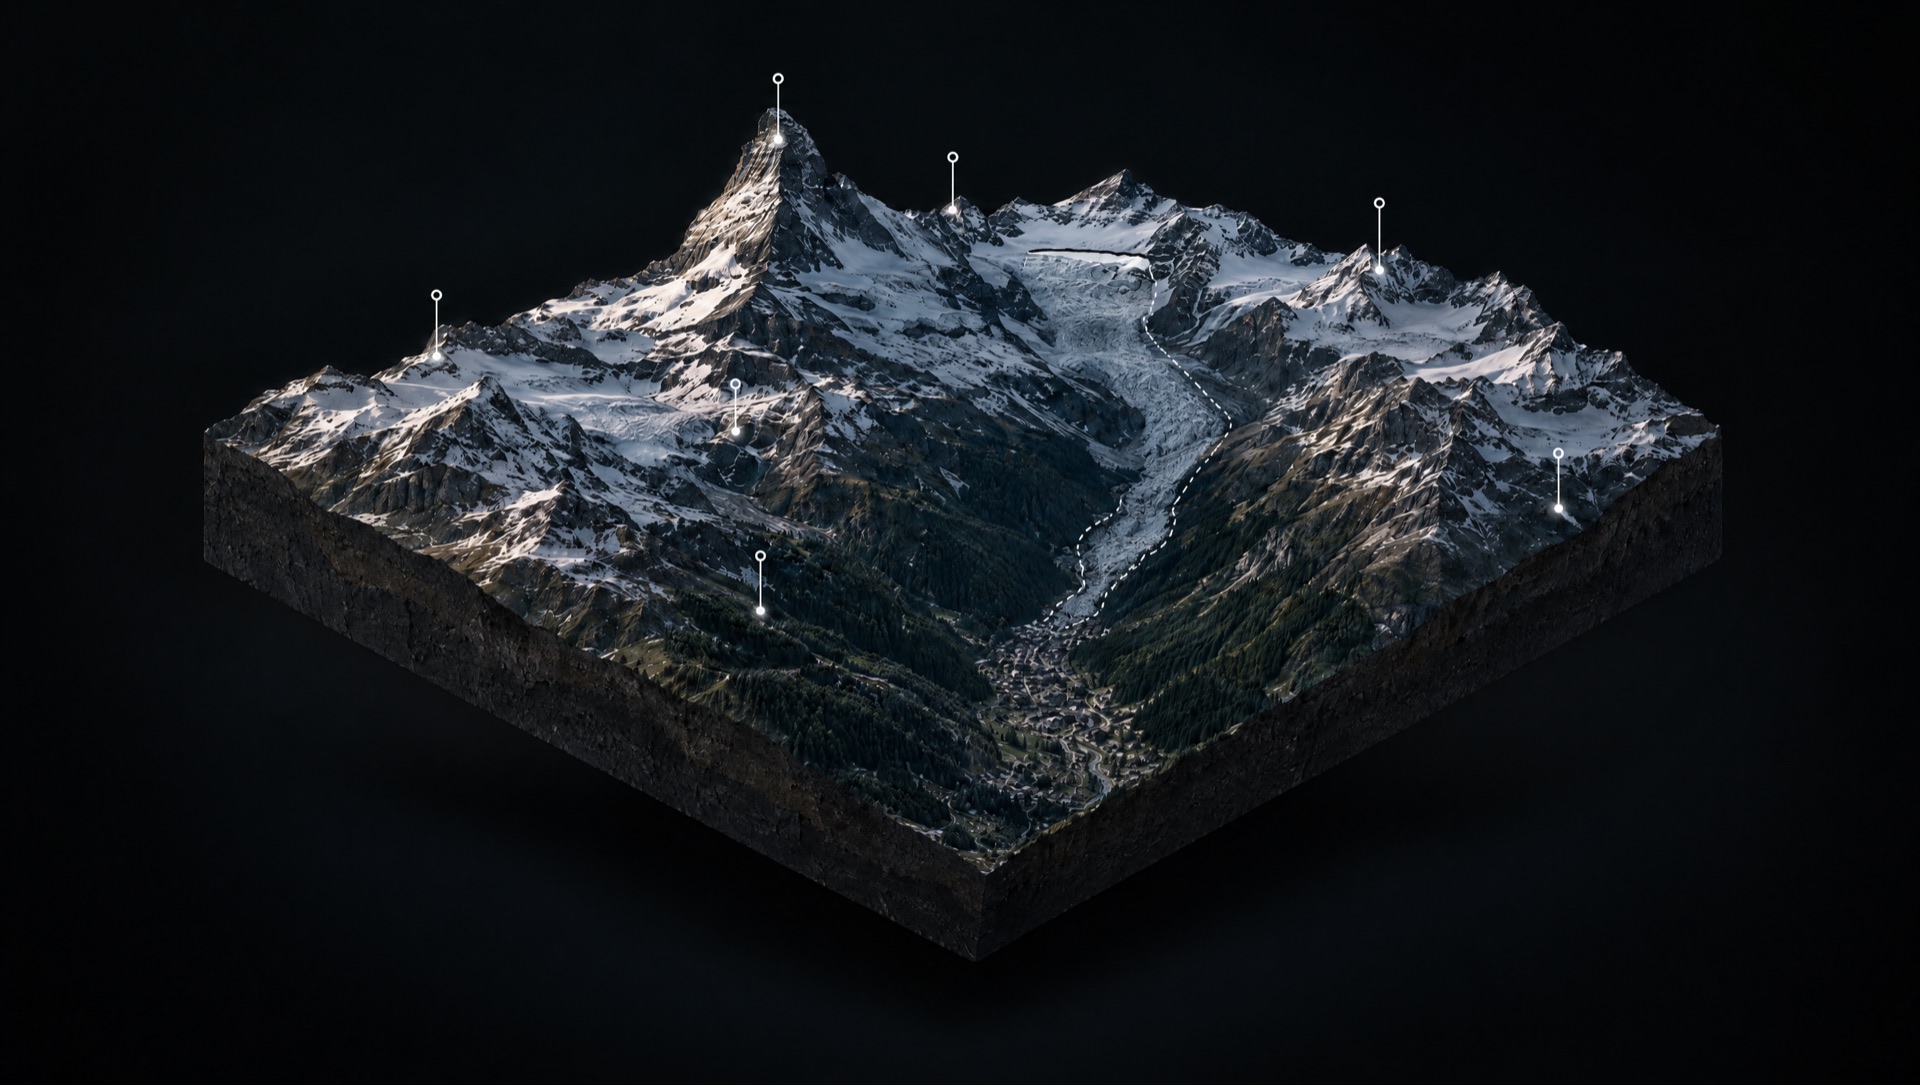
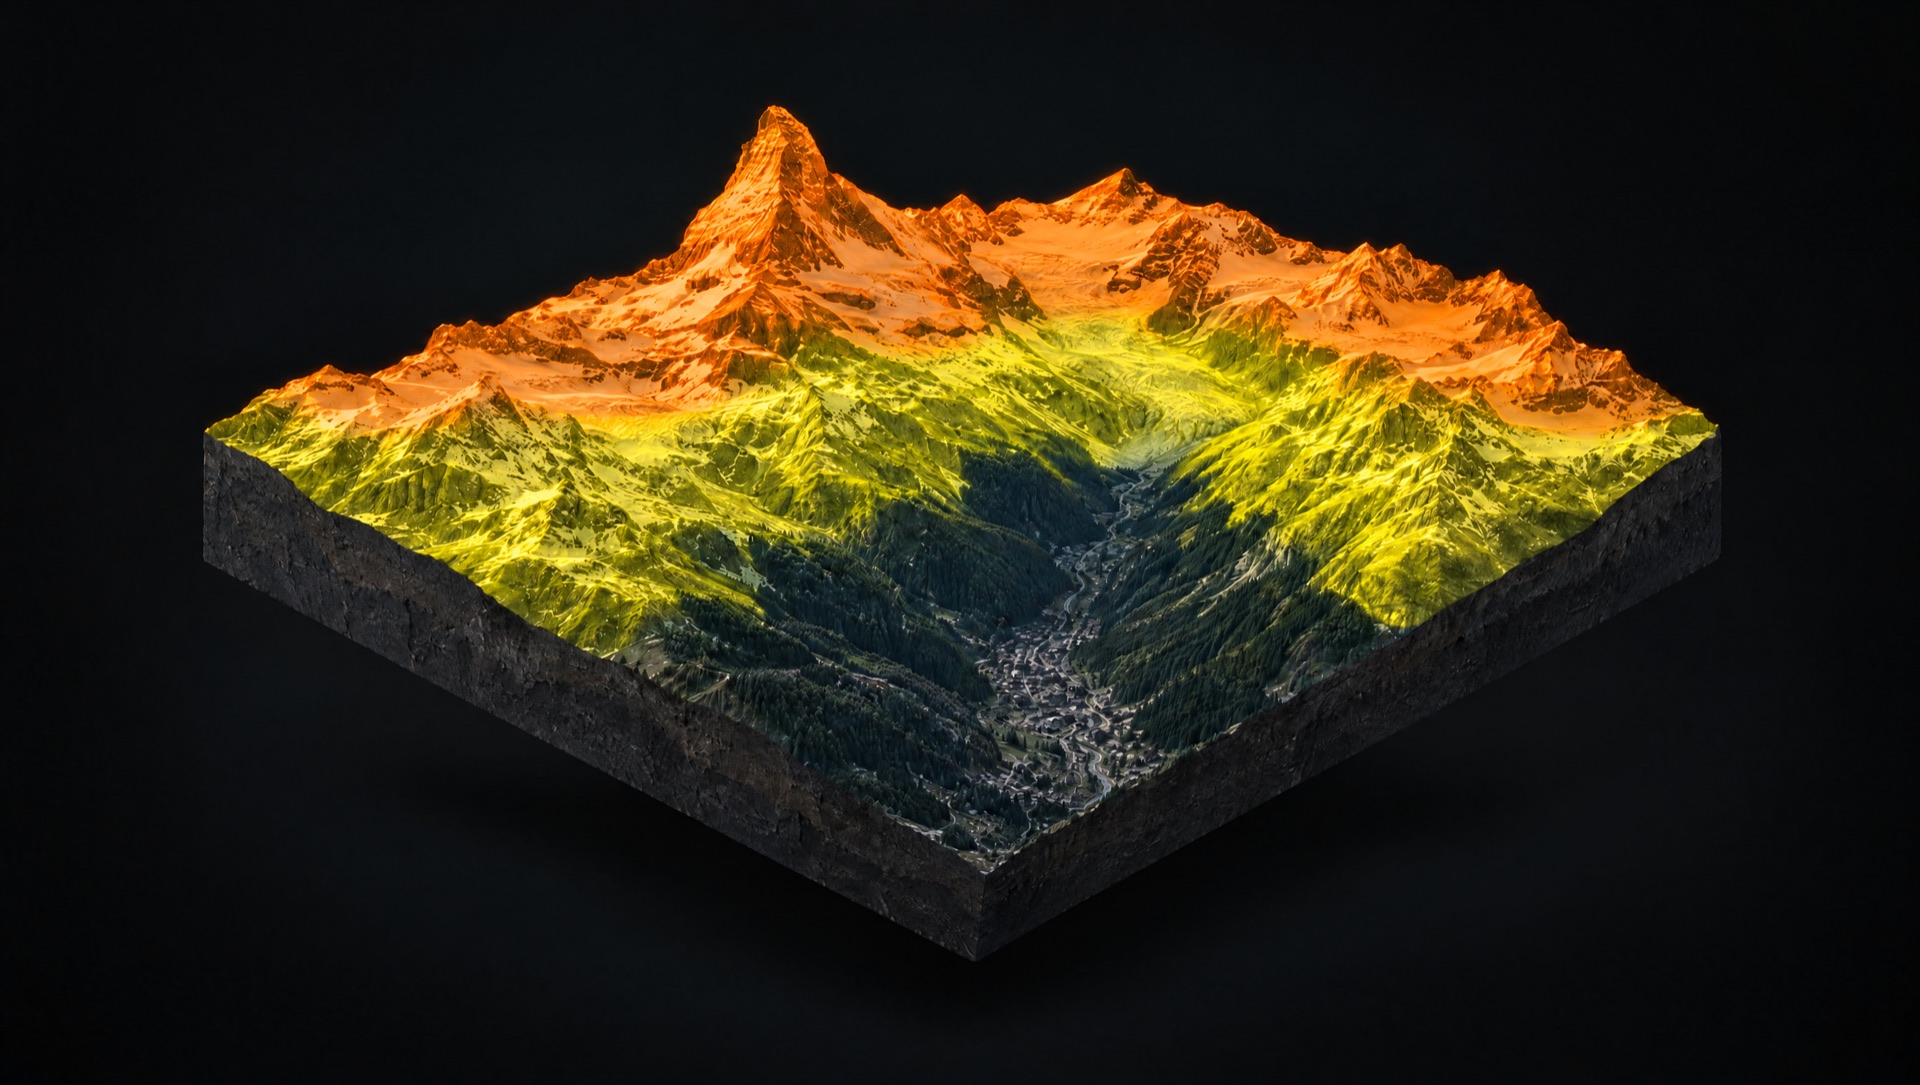
Each layer drapes over the same 3D terrain. Turn one on and the whole mountain answers a different question. Pick one, or let it play.
The relief is built from swissALTI3D, a half-metre elevation model, so every couloir, rib and roll is really there. Click anywhere for elevation, slope and aspect.
Terrain model only. Does not reflect current snow conditions. Source: swisstopo swissALTI3D, 0.5 m.
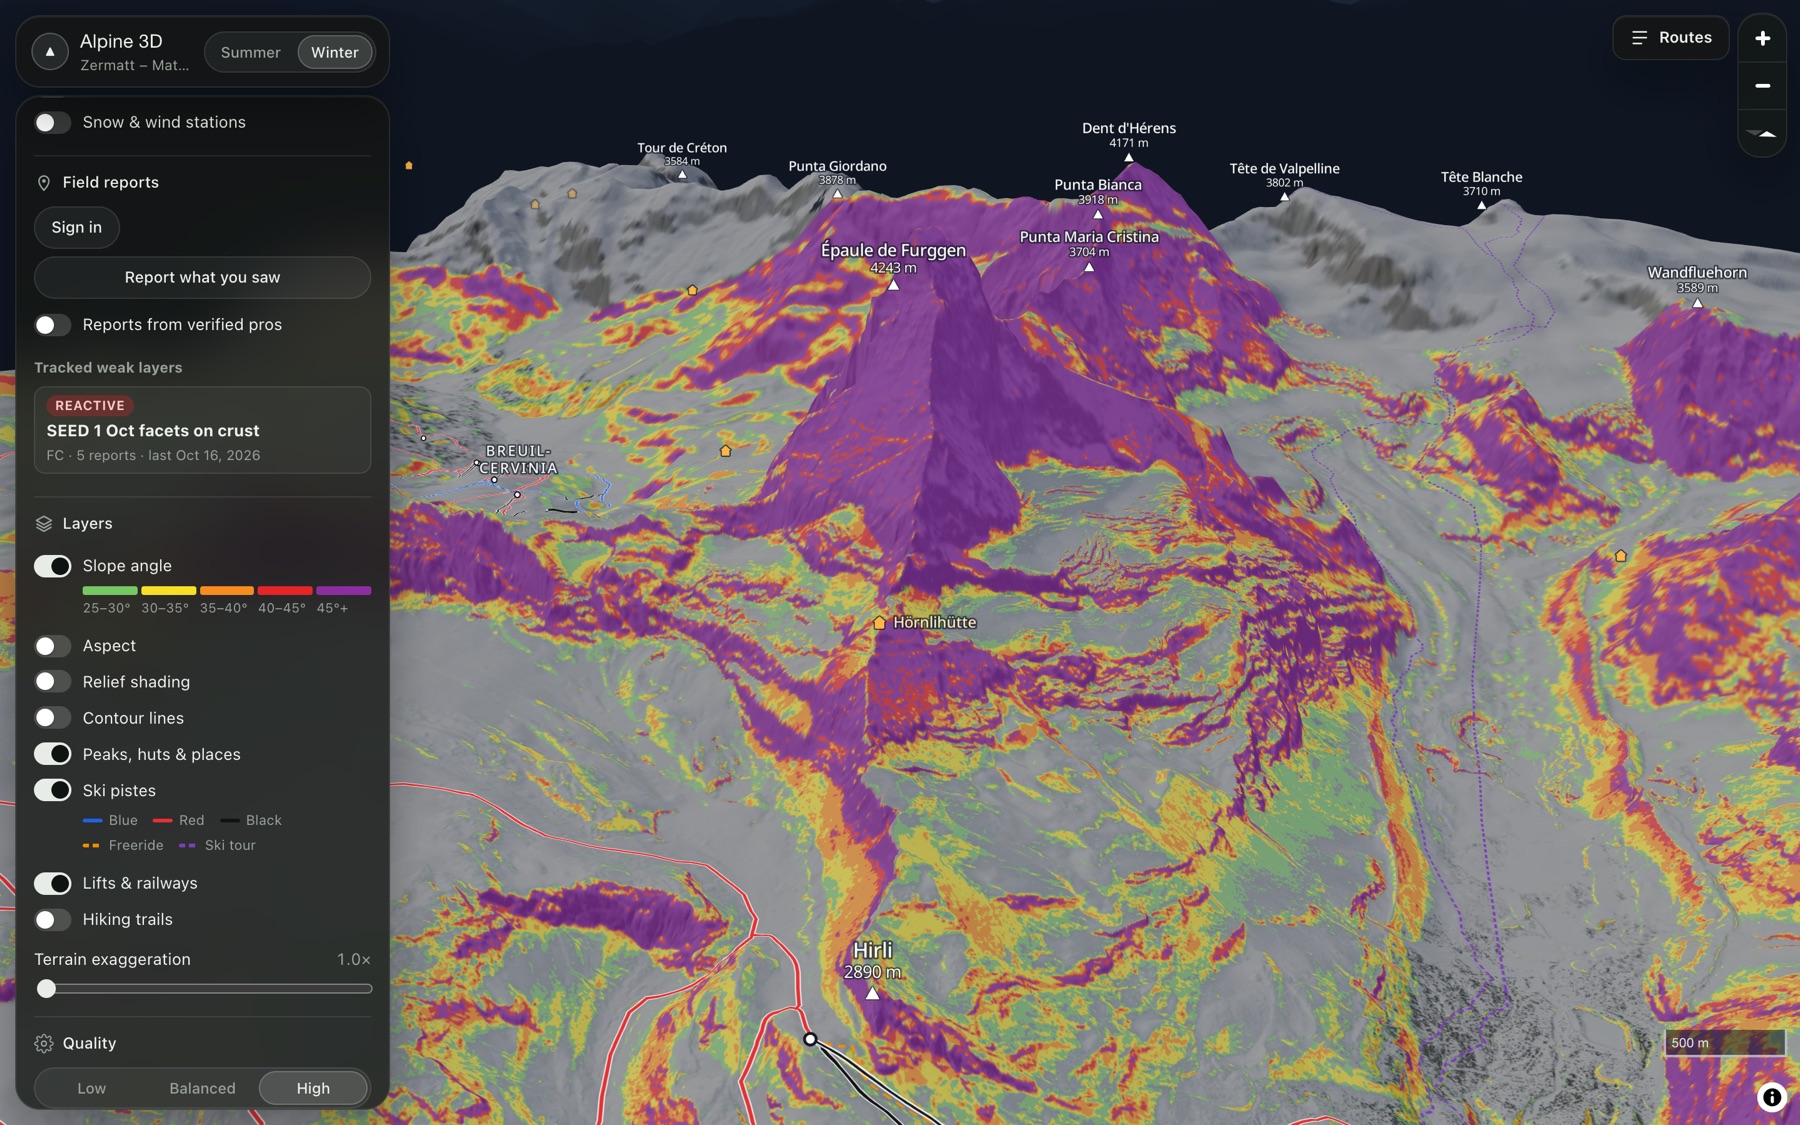
30–35°, 35–40°, 40–45° and steeper. Pick the default bands or a CalTopo-style preset, then filter by aspect and elevation so only the slopes a problem applies to light up.
Terrain model only. Does not reflect current snow conditions. Source: swisstopo swissALTI3D, 0.5 m.
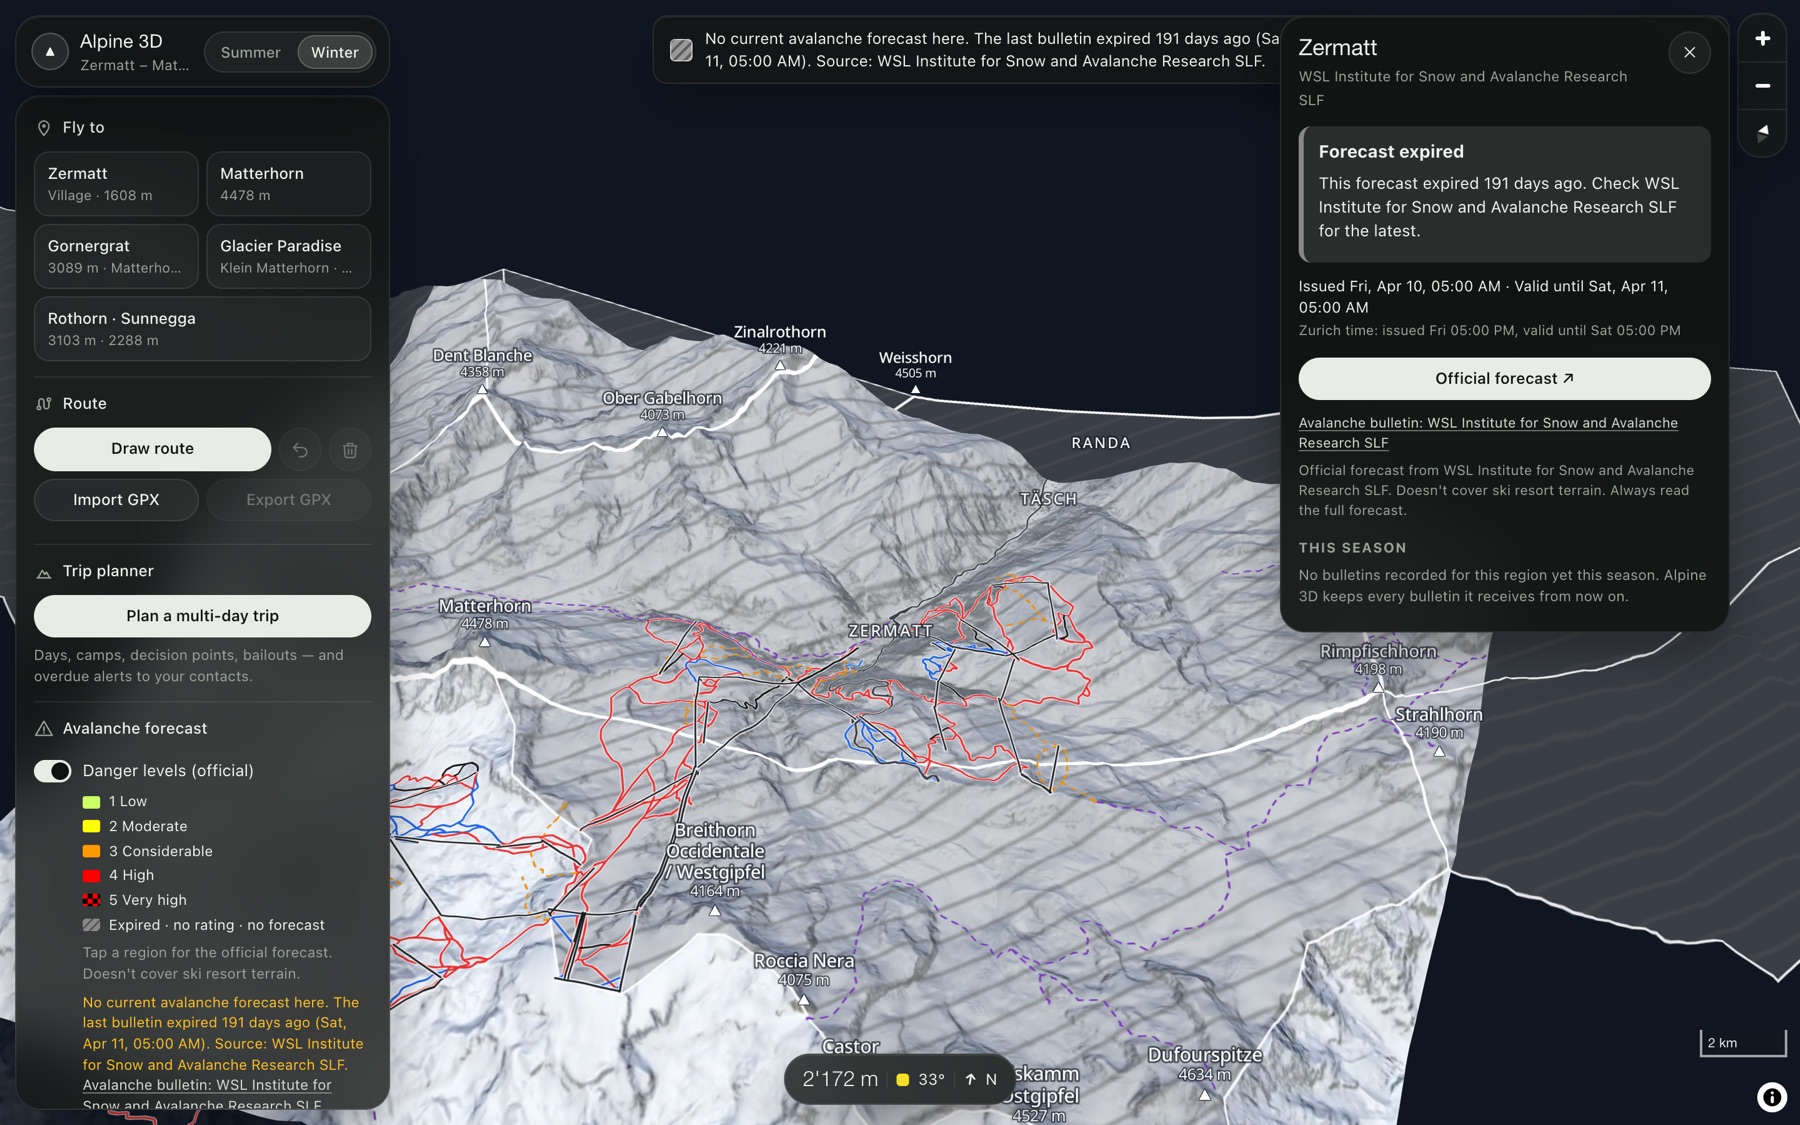
We ingest the SLF bulletin every 15 minutes and show it unchanged: provider, issue time, valid-until and a link to the original. Expired, off-season and unavailable forecasts turn grey and say so.
Illustration. In the app the colours come only from the current SLF bulletin.
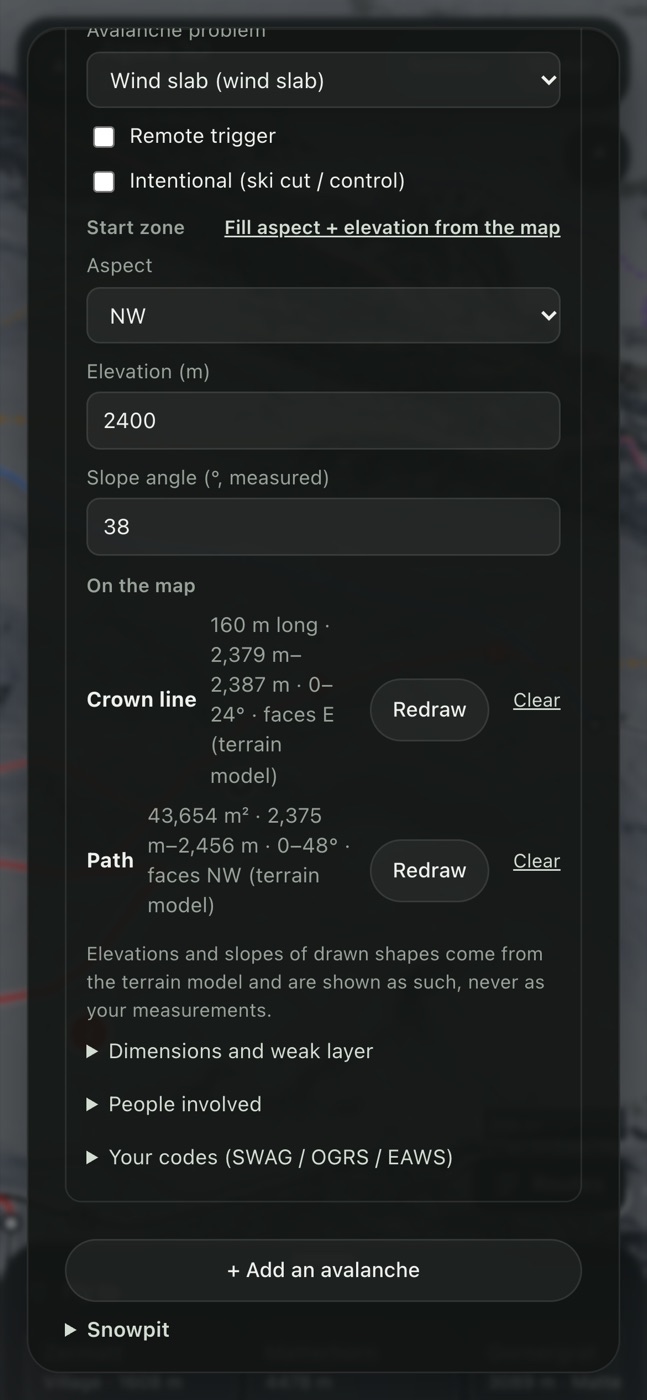
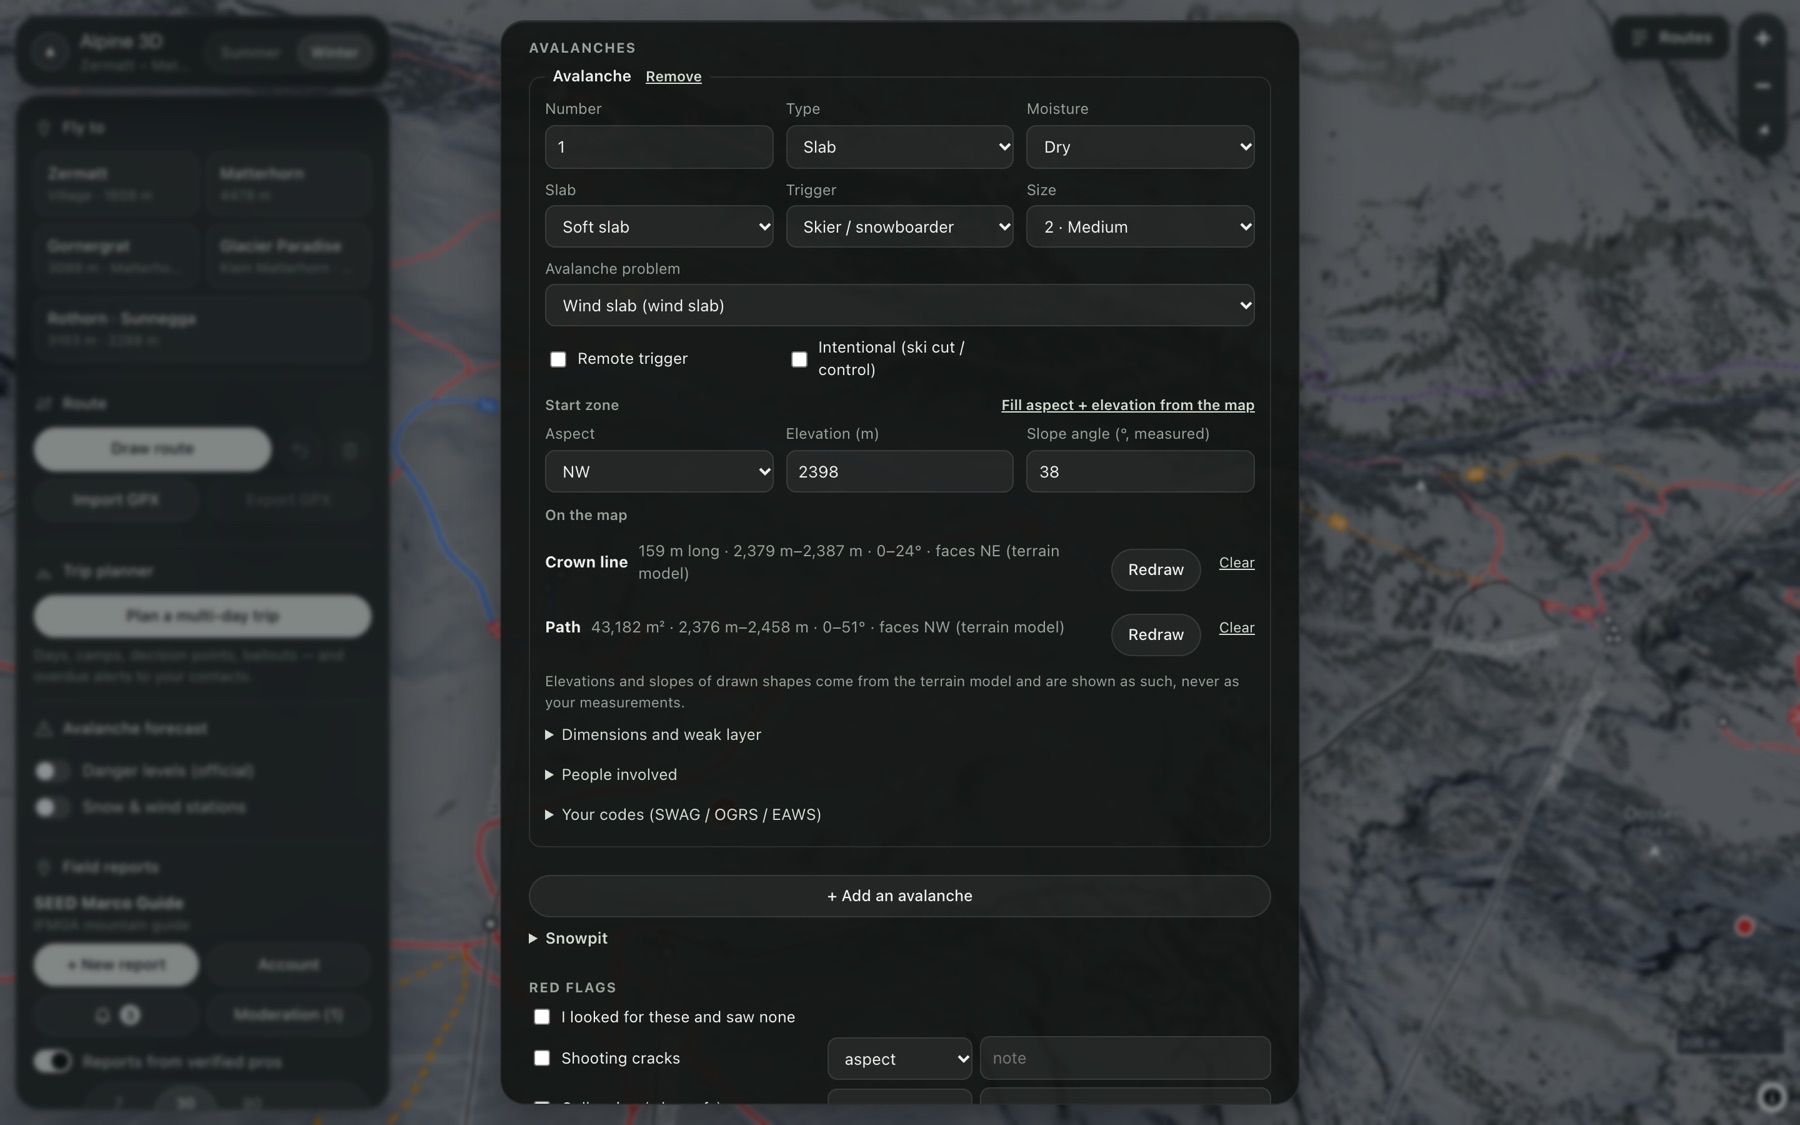
Guides, patrollers and forecasters pin avalanches, red flags, weather and stability tests to the slope they were on. Draw the crown and the path; we compute its terrain from the DEM.
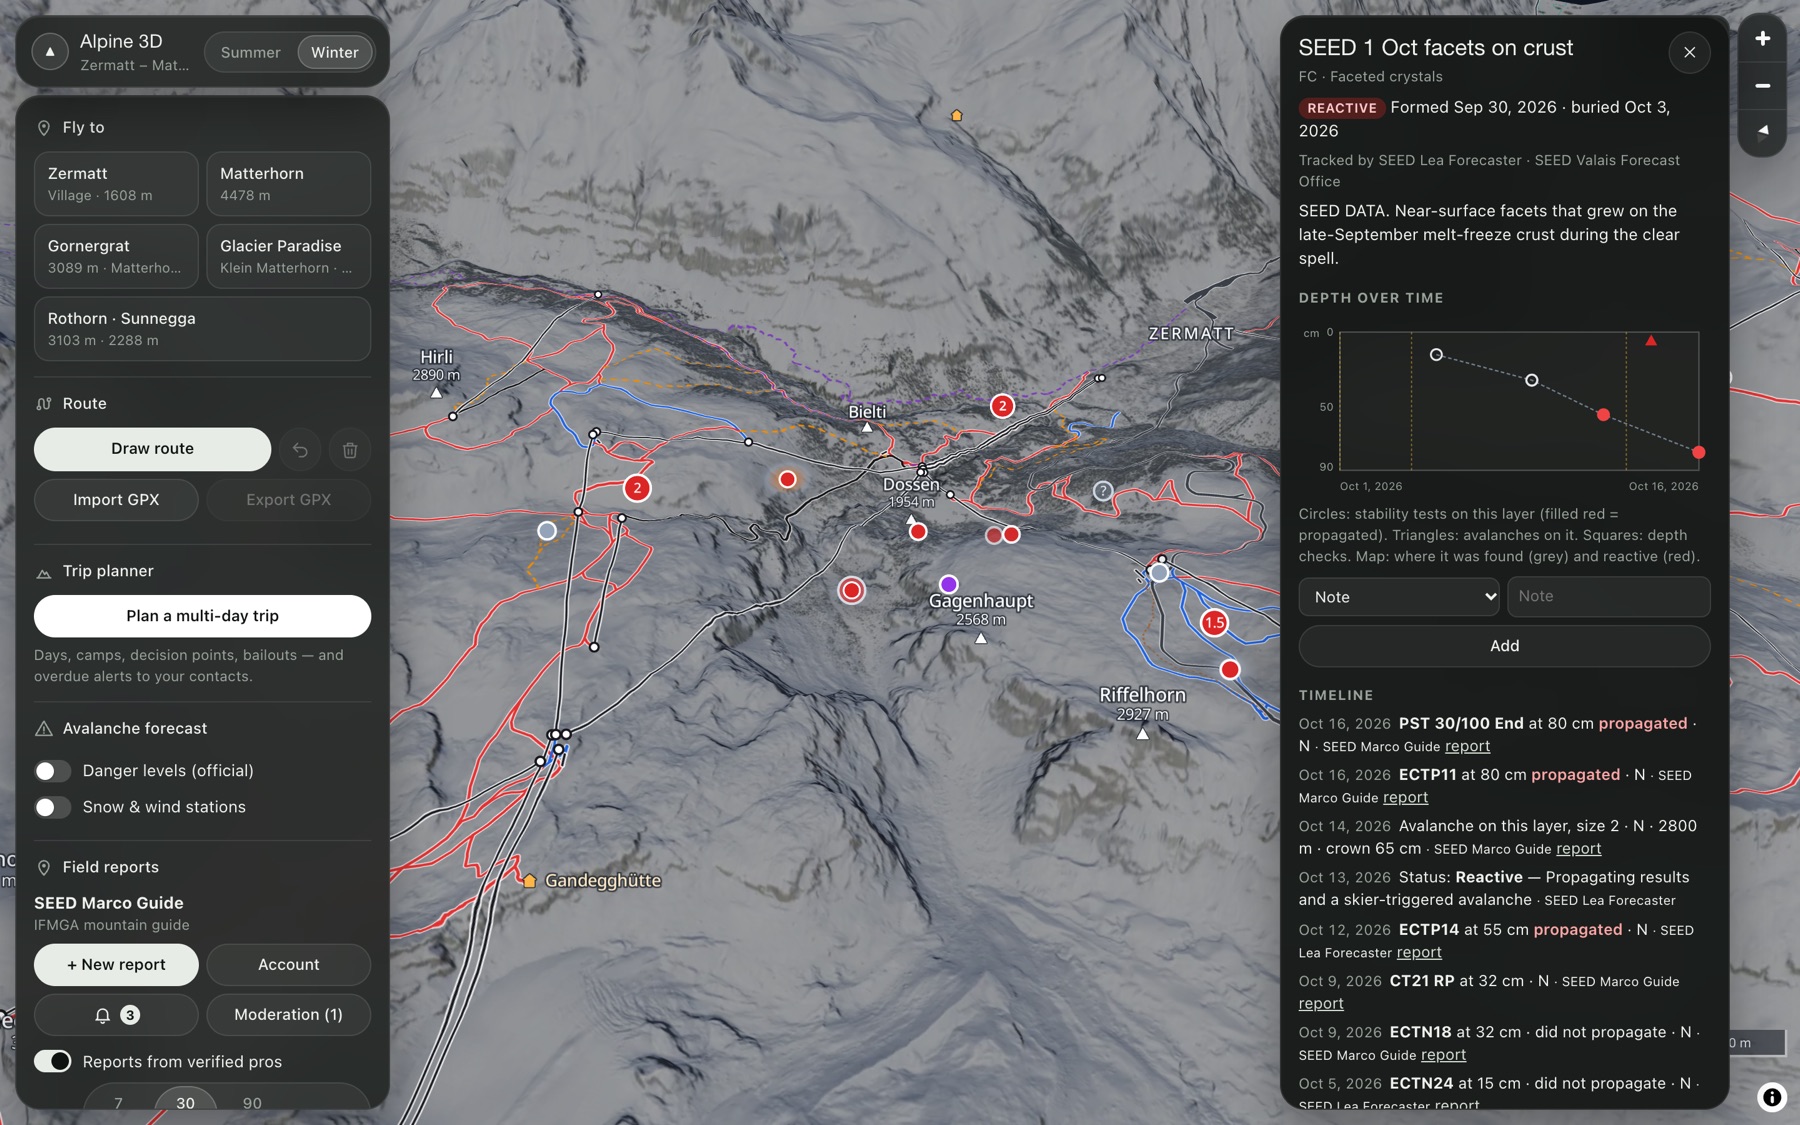
Reports from people. Each shows its author, organisation, time and age.
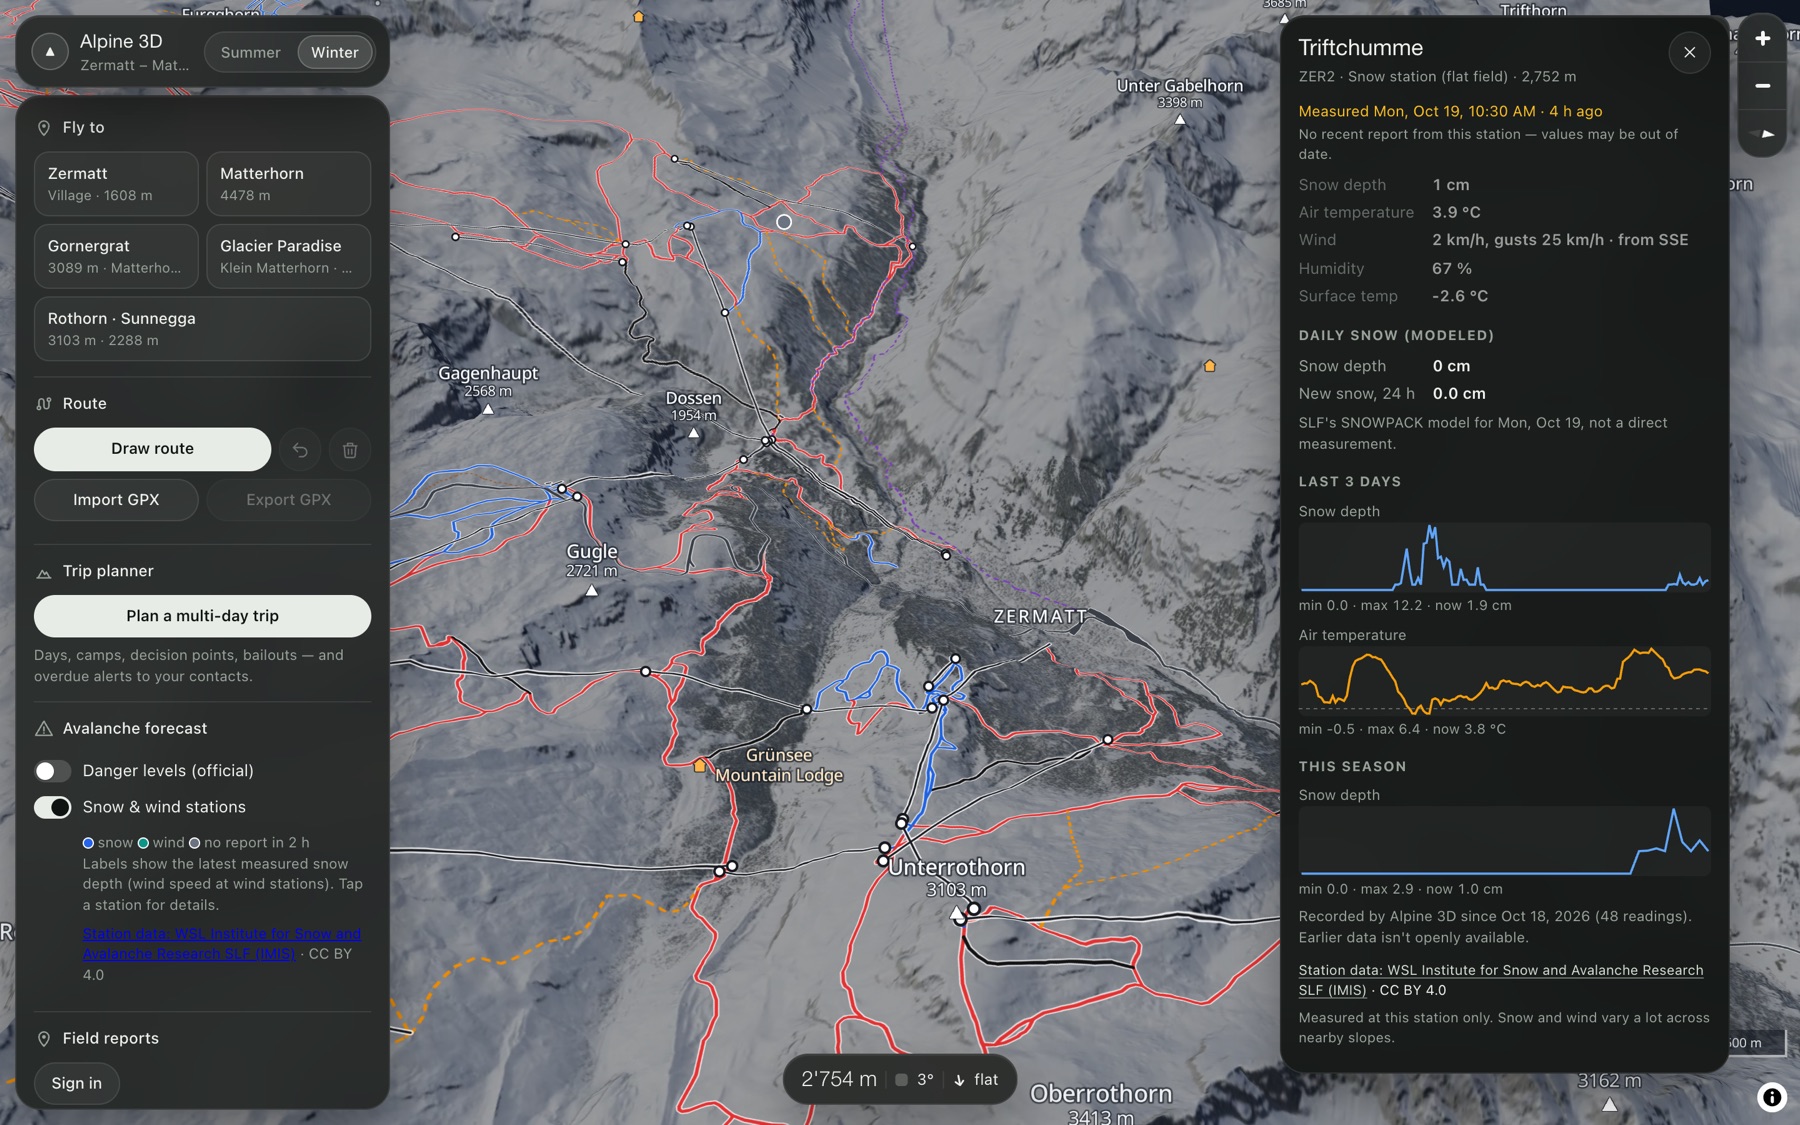
IMIS snow and wind stations on the ridges: snow depth, new snow, wind, temperature. SLF open data keeps seven days. We keep every reading, so you can see the whole season.
Station data shows its age. Old readings are marked as old.
New snow over 24 and 72 hours, by elevation. Combined with wind, it tells you which aspects are taking on load. That is where the problems start.
See where the rain line sits against the terrain. Rain on a cold snowpack changes the day fast, and the map shows the slopes below that line.
Low cloud in the valley, clear skies on the peaks. Know what visibility you will have at the col before you leave the hut.
Scrub the clock and watch shadows move across real terrain. Time a corn-snow descent, an east-face exit before it warms, or a shaded skin track.
Every hiking path and alpine route, plus the huts, drawn on the 3D terrain. Pick a route and you get its profile, distance, gain and steepest section.
Switch to winter and the whole map changes: snow cover, blue, red and black pistes, and the lifts and cable cars linking Sunnegga, Gornergrat and Matterhorn Glacier Paradise.
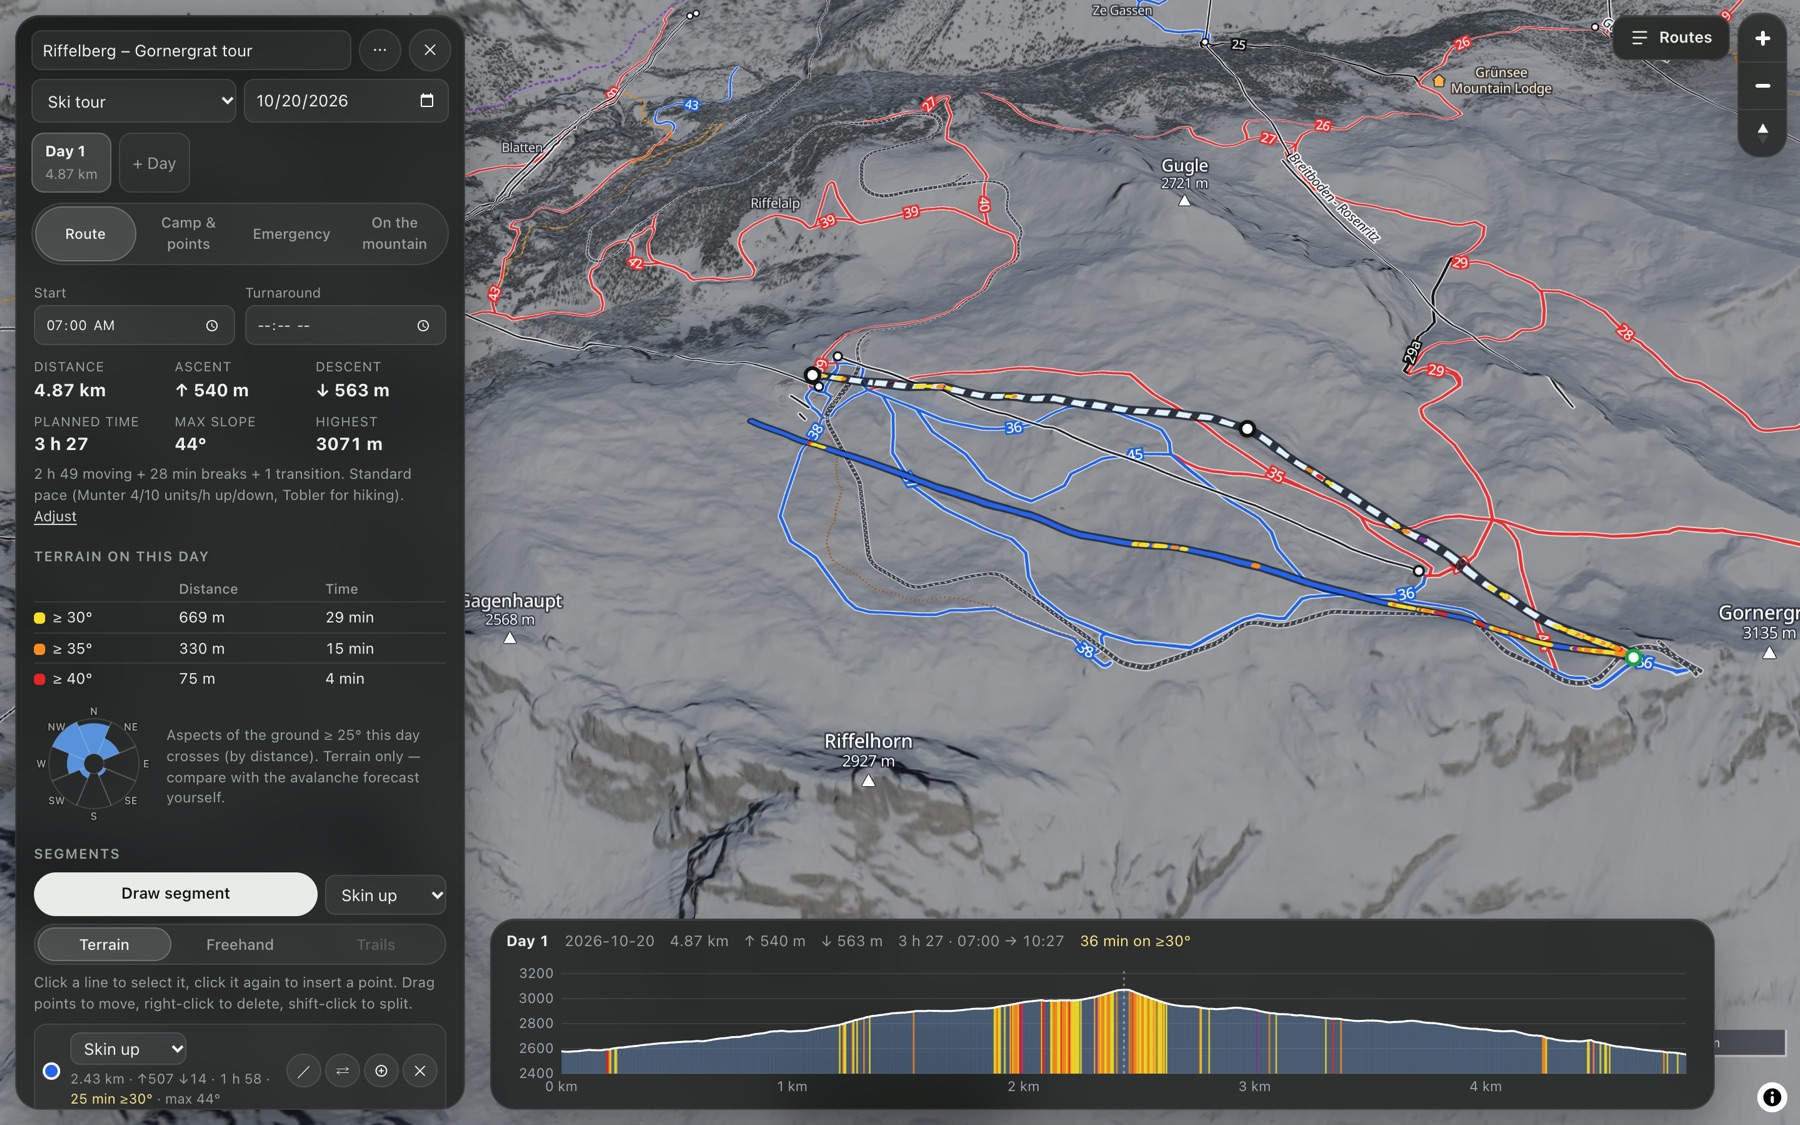
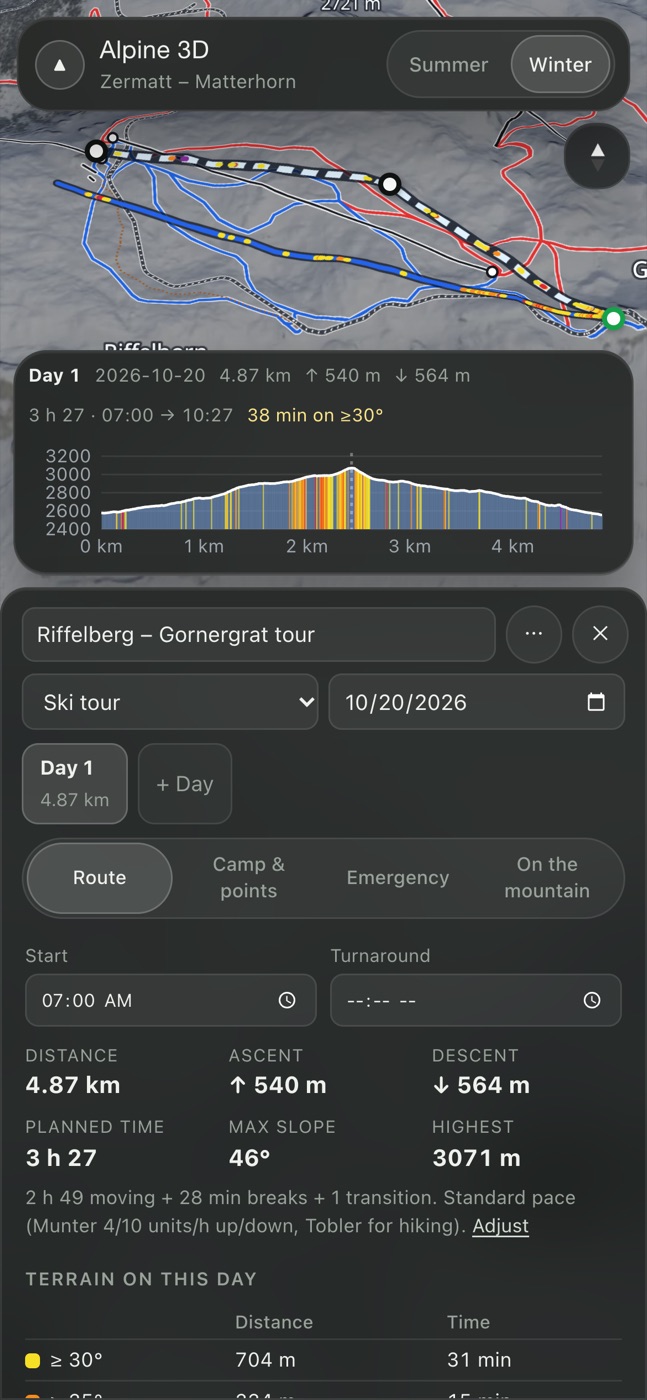
Plan a ski tour, export it as GPX, take it offline and share it with your group. If you are overdue, the people you chose get an alert.
The app
Everything below is Aspect running today, recorded straight from the app with its own data.
The professional network
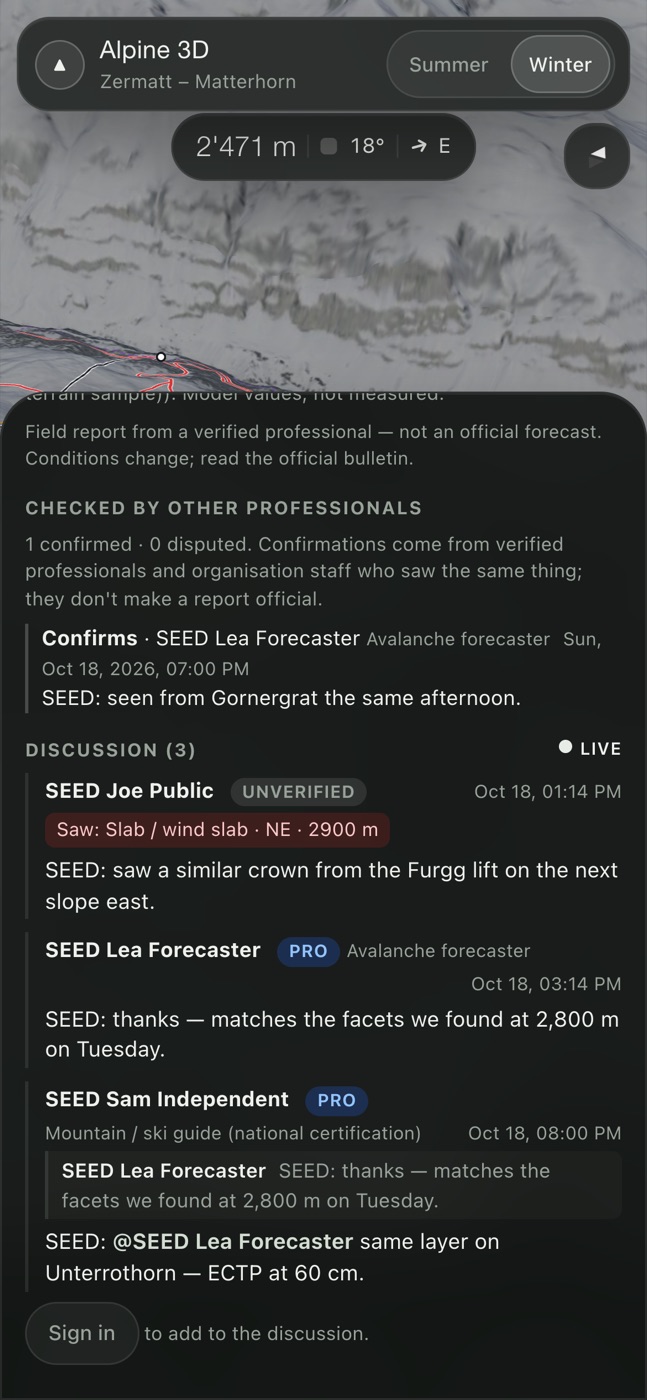
Forecasters, patrollers, mountain guides and observers share what they find in the field, on the map, the moment they find it. Every report starts a conversation with the people who need it.
The life of a report
AvalancheSlab · D2 · natural
WhereNE · 2,850 m · 38°
ProblemWind slab
TestECTP12 SC down 45
Same signs on the Stockhorn NE side, 2,900 m. Shooting cracks on the skin track. ECTP14, down 40 on buried surface hoar.
@Mountain guide was the bed surface the mid-January crust?
Yes. Failed on the crust, about 45 cm down. Photo of the bed surface added.
Saw a fresh crown below the Stockhorn from the Gornergrat train around 10:15.
See every report in their zones, including restricted incident data. Ask questions, and later draft and publish forecasts.
Post under their organisation. Keep internal notes private to the patrol, or share them with the network.
Report from every tour. Your guide office vouches for its staff, and the badge shows it.
Independent professionals, verified by hand before their first report goes live.
Read every public report and its thread, and add sightings. They are always labelled as public.
Each report chooses its circle: your organisation, the network of organisations that opted in, or everyone. Incident involvement never leaves the inner circle.
Avalanche operations
Forecasters, guides, patrollers and observers share one picture of the snowpack: the official forecast, then what people saw, measured and tested, with the evidence one tap away.
A guide pins a fresh slab on the slope they were on. The crown and path are drawn on the map and follow the real fall line.
Size, trigger, problem, the test that explains it, photos and a thread with the people who know the area.
The forecast's danger rose is painted onto the terrain: every aspect and elevation band in its rating's colour, on slopes steep enough to slide.
Point at any slope for its aspect, elevation, angle, rating and problem, taken straight from the forecast. Try it: move over the terrain.
Crown about 60 cmInside the 3 Considerable zone · Wind slab
Danger rose Example forecast
Bands: below 2,600 m · 2,600–3,100 m · above 3,100 m (example limits)
Example forecast and report. Uncoloured slopes are not lower danger; they are outside the aspects, elevations or slope angles shown. The public map shows SLF's bulletin exactly as published.
Shown as published, never averaged, blended or re-derived. Where SLF splits a region, the map uses the highest published rating and a split badge, just like SLF's own map.
Anything that isn't a current rating is grey and says why, so it never looks like low danger.
8 aspects × 3 elevation bands. Band limits are set per zone, and the same rose can recolour the 3D terrain so you see exactly which slopes it covers.
One report per field visit with optional sections: avalanches, red flags, weather, incident, photos. Revisions are append-only; reports are withdrawn, never deleted.
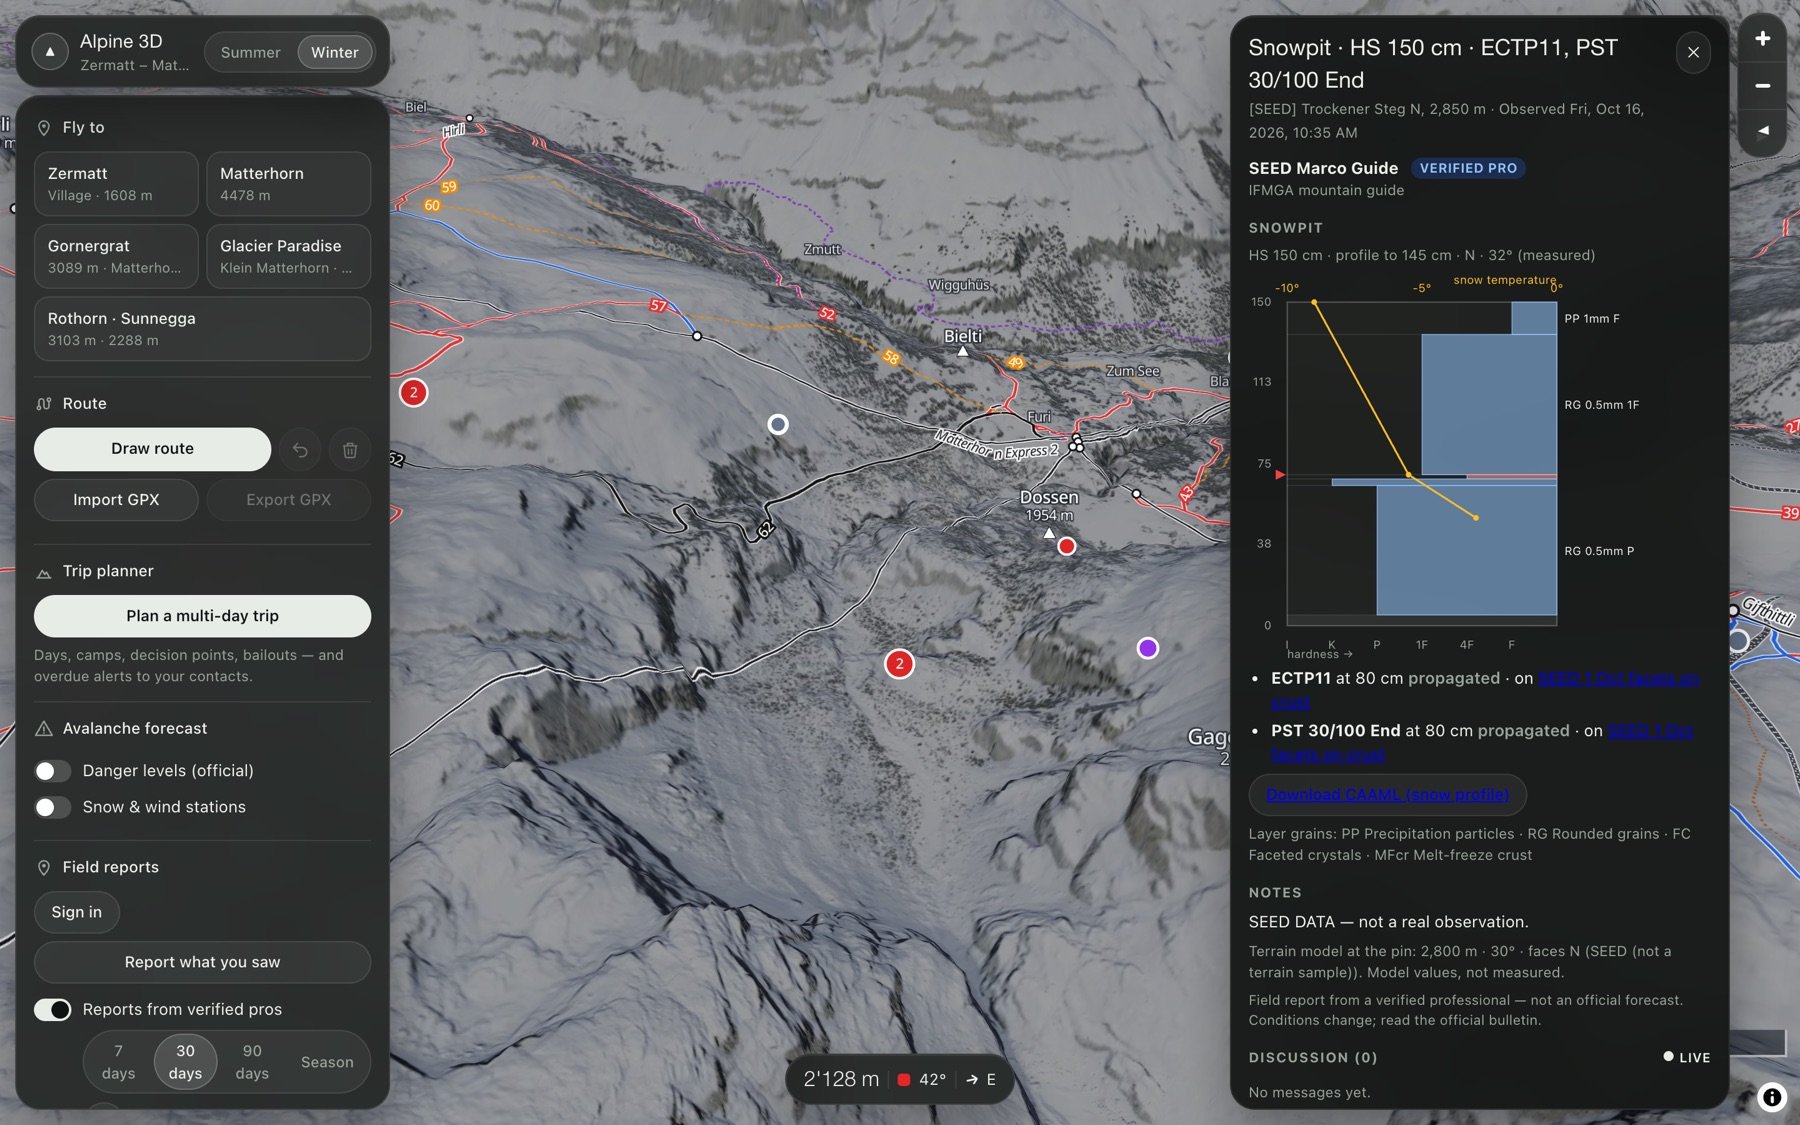
Hand hardness bars, temperature curve, ICSSG grain types and test results on one profile, exported as CAAML v6. A weak-layer tracker follows each layer through the season.
Caught, buried, injured or killed: incident involvement is visible only to the author, the owning organisation and forecasters. Shared photos have their location data removed.
One international observation model that keeps each standard's own codes word for word. EAWS terms first in the Alps; North American terms are one switch away, mapped but never auto-converted back.
Every bulletin, station reading and report from the season, on one timeline. Scrub back to the storm that built the layer you are worried about.
The data underneath
Aspect pulls official bulletins, station networks and weather models every 15 minutes, checks them, keeps the raw copy, and turns them into features forecasters can use. Nothing is guessed and nothing is thrown away.
Sources
Ingest
Check and keep
Features
Out
Feature engine
Zermatt · above treeline · last 24 h
Example output. Features are model and station values with their unit, source and window. They never change a measured value or an official rating.
Station QC
Readings are flagged, never changed. A flagged value stays visible with its flag.
NE–E aspects, above treeline: wind loading 212 m/s·h and 34 cm new snow in 24 h. Rule: your Zermatt alerts.
Automated weather-model alert. Not an avalanche forecast.
Unknown values are refused and raise an alert. A rating is never guessed.
Every provider response is stored as received, so any day can be replayed and checked.
Times are stored in UTC. A provider time without a zone is read the way that provider publishes it.
Terrain and weather-model values sit beside what people measured and never fill it in.
Trip planner
Under the snow
Every number on the map can be traced back to where it came from.
swissALTI3D elevation turned into terrain tiles quantised to 1/32 m, finer than the model's own accuracy.
SWISSIMAGE from a single 2023 flight with matched sun angle, so snow and rock shadows agree across the map.
The CAAML parser refuses unknown values and raises an alert. It never guesses a rating.
Raw provider payloads and every station reading are archived, so any season can be replayed.
Append-only revisions and an audit log, enforced in the database itself, not only in app code.
Who sees what is decided in one place and tested against a full matrix of roles and visibility.
Slope and aspect from the DEM are stored alongside what the observer measured and never fill it in silently.
Everything is stored in UTC. Photo times are used only when the camera recorded a time zone.
Where it's going
Organisations, visibility rules, shared avalanche vocabulary.
Report sections, crown and path drawing, photos, filters.
Profiles, CAAML export, weak-layer tracker.
Live threads, mentions, confirm or dispute, moderation.
Aspect × elevation × slope filter, ATES, offline zone packs.
Weather models, wind loading, warming and solar indices, rule alerts.
An explainable engine that drafts a forecast from the evidence. Only a named forecaster can publish it.
Backtests against the archived season, with hit, miss and calibration scores.
Our rules
The official forecast is the official forecast. We show it as published and link to the source.
Grey means no rating. Expired or missing data is never shown as low danger.
A model is labelled as a model. Terrain layers say what they are and where they came from.
Reports are from people. With a name, a time and an age. Unverified ones say so.
Drafts stay drafts until a forecaster signs them.
Aspect
Pro access is for guides, patrollers, forecasters and observers, checked by hand. Organisations can bring their whole team.